
Powering a 1 MW AI rack with 800 V DC
On an ideal DC bus, 1 MW corresponds to about 18,519 amps at 54 volts or 1,250 amps at 800 volts. In NVIDIA’s 2025 design, carrying 800 volts to the compute tray shortens the path that must carry very high current. For a data centre developer, the harder question is how much power each rack can still receive when a rectifier fails.
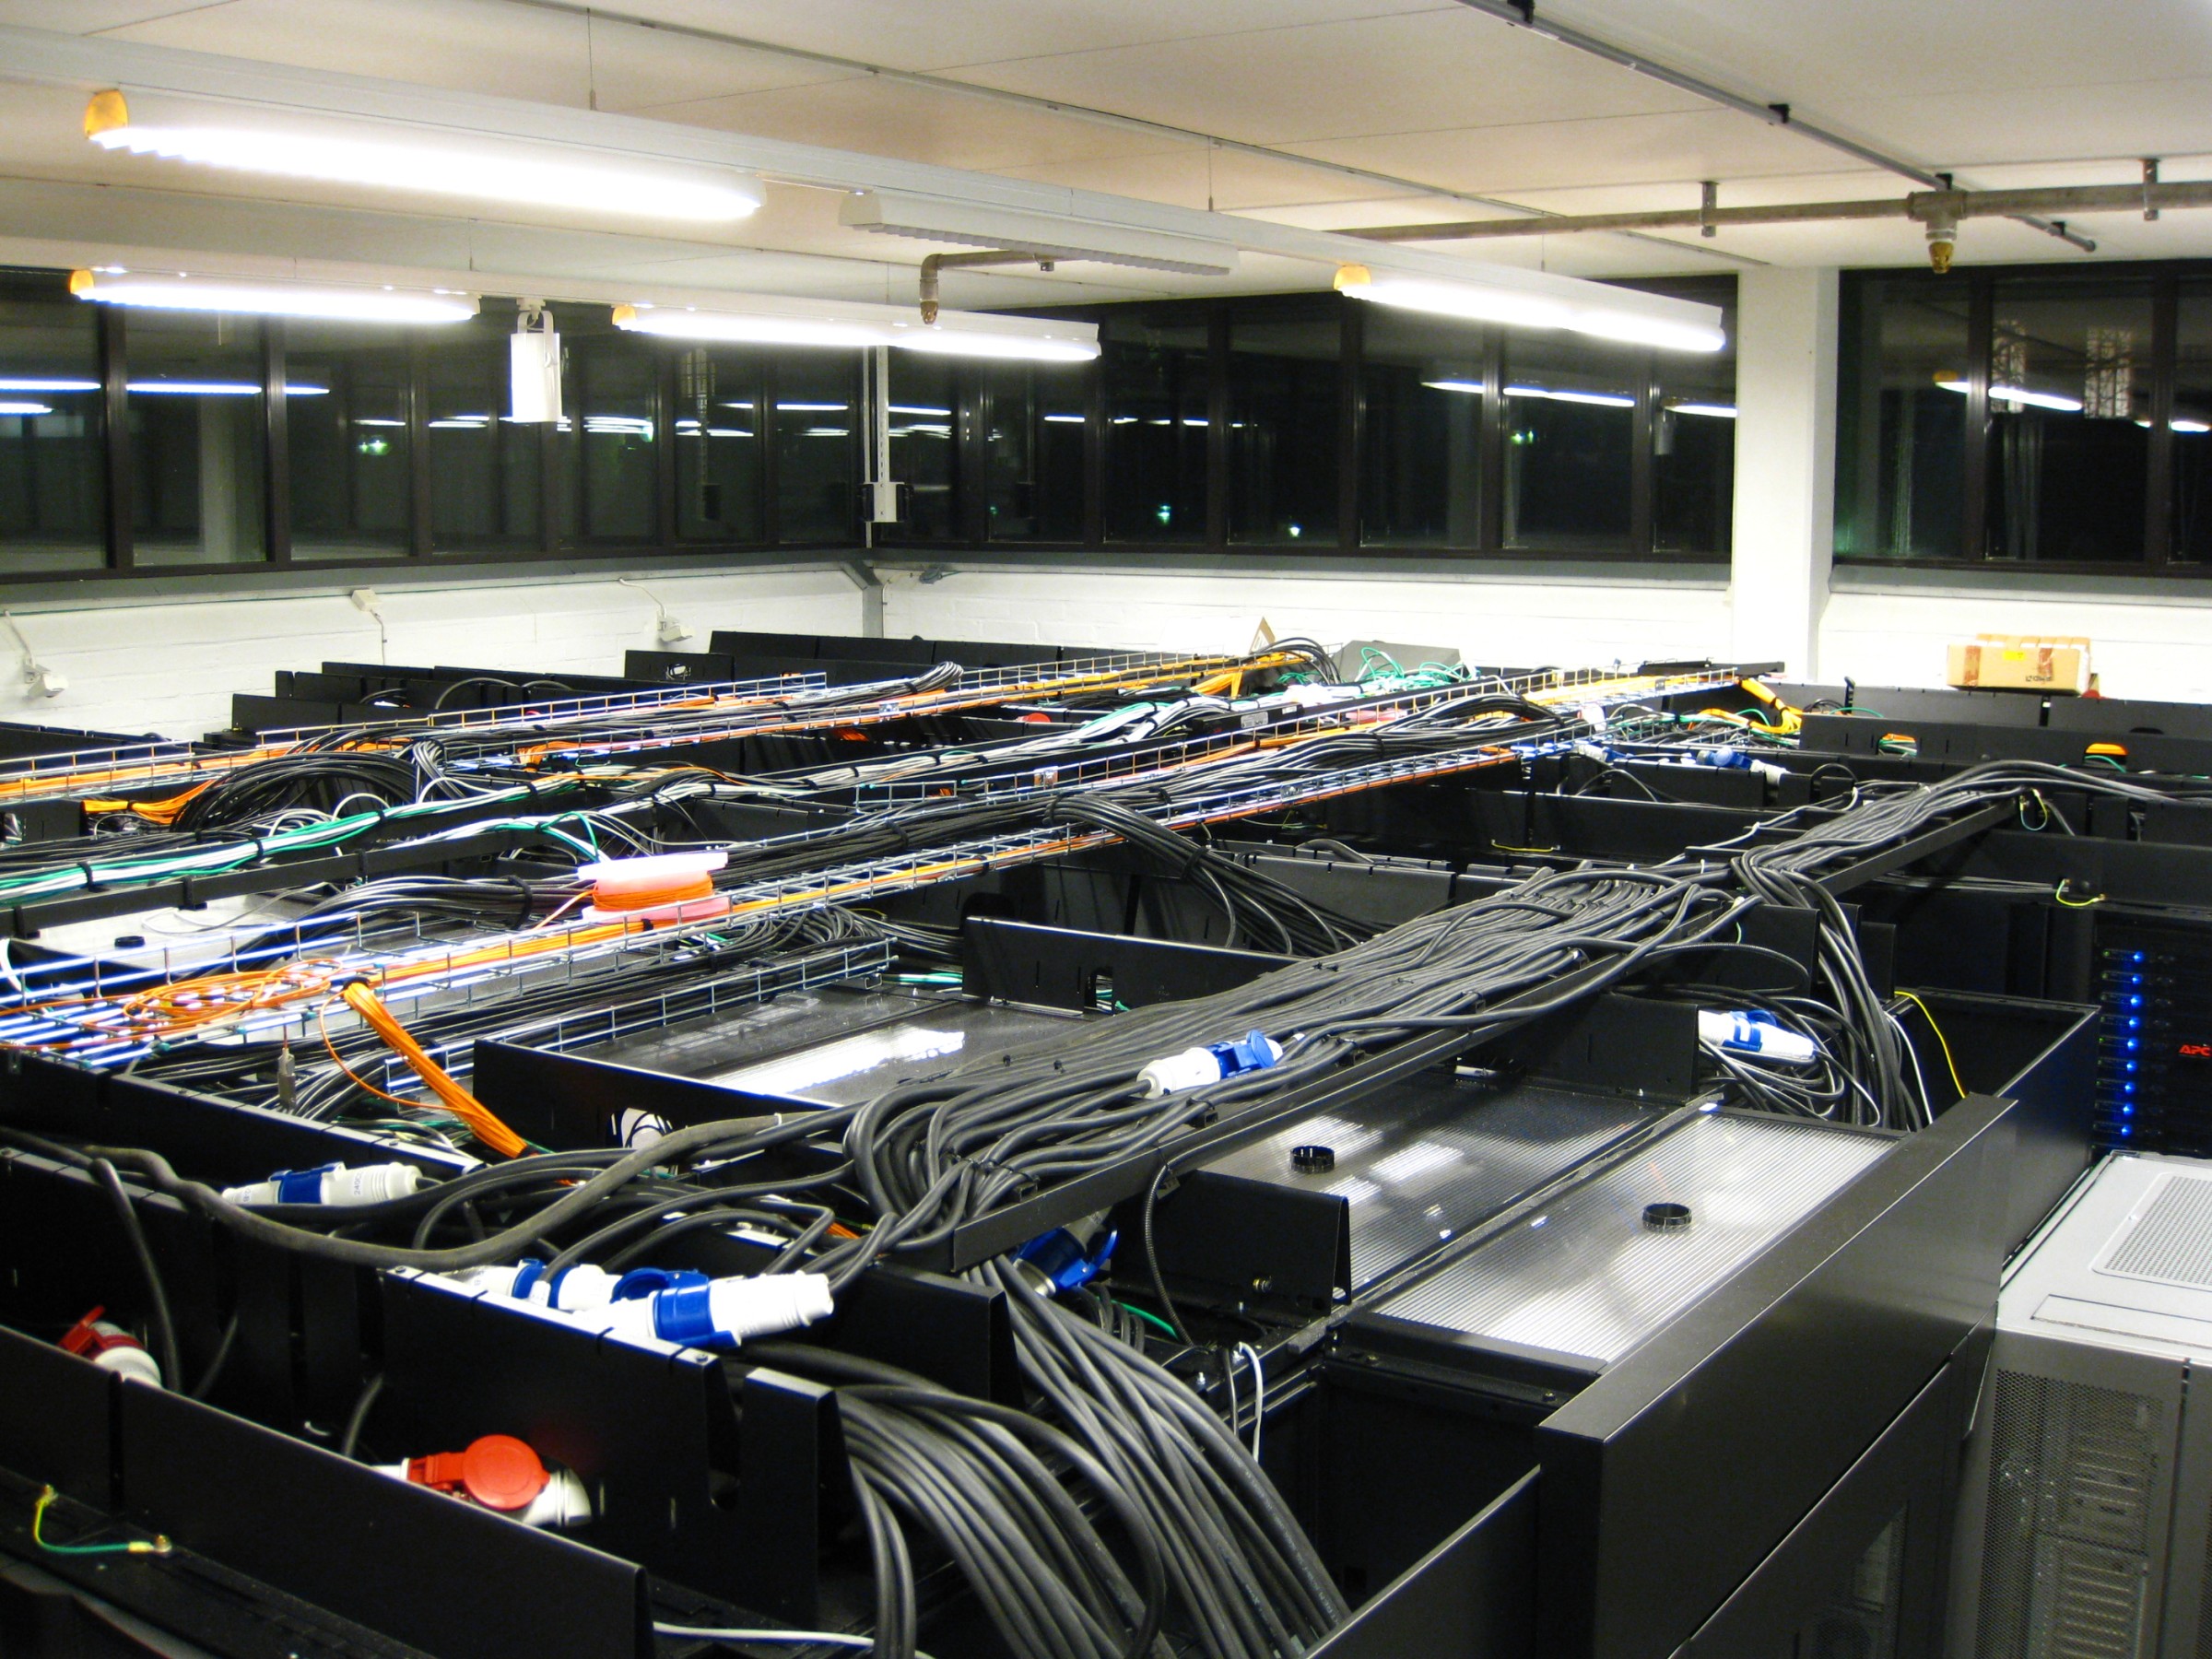
During distributed training, graphics processing units (GPUs) exchange data. NVIDIA’s high-speed copper NVLink connections have a limited reach. Packing more GPUs within that reach concentrates the electrical load into a smaller footprint. A site can have enough megawatts at the grid connection and still struggle to deliver them over the last few metres. [1]

Why the 54 V bus gets crowded
For direct current (DC), power equals voltage multiplied by current. At the same 1 MW on the bus, raising the voltage from 54 V to 800 V cuts the current by a factor of 14.8. The 54 V figure is the aggregate inside the rack, shared across its power paths. The proposed 800 V bus can also carry power across a data hall.
Resistive heating follows I²R. Halving the current through the same resistance cuts the heat produced in that conductor to one quarter. Designers can use that margin to reduce losses, change conductor size or fit more capacity into the space available. A site efficiency estimate still needs actual cable lengths, conductor sizes and converter efficiencies at the expected load.
For a balanced three-phase AC supply, 1 MW of real input power at 415 V line-to-line and a power factor of one draws about 1,391 A per line. Delivering 1 MW downstream requires extra input to cover conversion losses. A copper comparison also needs the number, length and cross-section of the conductors.
Where should AC become DC?
In a conventional design, a transformer steps down the incoming medium voltage. The hall distributes alternating current (AC), often at 415 V three-phase. Power supplies inside each rack convert it to DC. An 800 V design lets the developer move that conversion point. Each location changes which equipment can stay and which equipment must be replaced. [1]

For an existing hall, a neighbouring power cabinet, often called a sidecar, can convert AC to 800 V DC over a short run to the compute racks. It frees up rack space for servers. The row still needs floor space for the sidecar, sufficient upstream AC capacity and access for maintenance.
For a new hall, rectifiers can sit downstream of the building’s medium-to-low-voltage transformer. Another option integrates transformation and rectification at the medium-voltage intake. Industrial transformer-rectifiers are established technology. Multi-megawatt solid-state transformers are also under development. Their footprint, service arrangements and maturity differ. [1] [3]
Inside the rack, NVIDIA’s 2025 MGX reference design steps 800 V down to approximately 12 V near the GPU. Board-level regulators then supply the chip. NVIDIA reports that this conversion stage occupies 26% less area than its multistage alternative. At the October 2026 OCP Global Summit, Delta demonstrated a different implementation using a 90 kW power shelf to convert 800 V to 50 V. [1] [6]
How much of a GPU load swing reaches the grid?
Thousands of GPUs can calculate together, then exchange data or wait together. NVIDIA describes workloads that swing from roughly 30% to 100% of rack power. If ten 1 MW racks made that transition together, their combined demand would change by 7 MW. The ramp rate in MW per second also depends on the time taken. What reaches the grid depends on other site loads, storage and controls. [1]

Storage charges as the GPUs slow down and discharges when demand rises. Capacitors close to the compute trays can handle very short events, often under 100 milliseconds. Saving the model’s state, known as checkpointing, can create a change lasting one to five seconds. Over minutes, a battery system can manage a cluster ramp or bridge a transfer to a backup supply. GPU controls and storage controls need to work together. [1]
The same megawatt can require very different storage
Supplying an extra 1 MW for 0.1 seconds takes about 28 Wh. Supplying that same megawatt for five minutes takes 83.3 kWh. The power path must deliver 1 MW for the specified duration. If storage connects through a converter, its power rating must cover that duty. The energy figures exclude losses, ageing and reserve margins. Backup specifications also need a stated duration.
Reading NVIDIA’s 17.5 MW power block
Figure 11 of the white paper shows five 3.5 MW rectifiers, each taking 35 kV AC and delivering 800 V DC. In this “five-to-make-four” arrangement, losing one rectifier leaves four healthy modules. The number a tenant can contract for depends on how much power still reaches each rack during that fault. [1]

Figure 11 shows ten 1.1 MW compute racks, totalling 11 MW, plus cooling and IT support loads. It expands one distribution board to show four rack feeders. Each rack has two feeds from independent rectifiers. At nominal 800 V, 1.1 MW draws 1,375 A on a single feed carrying the full rack load, before losses. NVIDIA labels each rack branch 1,500 A. [1]
After one rectifier fails, four times 3.5 MW leaves 14 MW of nominal rectifier capacity. NVIDIA’s example puts up to 3.3 MW of compute load on one surviving source. To commit capacity to a tenant, trace the surviving feeders, include auxiliary loads and test the transfer with cooling running. The 35 kV intake is specific to this example. [1]
In August 2026, NVIDIA described an MGX-compatible power rack planned for the second half of 2026 and a row power centre rated at up to 2 MW per row, expected in 2027. For a committed delivery date, I would ask the supplier to confirm the exact configuration, lead time and acceptance tests. [2]
What one efficiency point is worth
Suppose the IT equipment receives 10 MW continuously. If end-to-end electrical efficiency rises from 96% to 97%, input falls from 10.417 MW to 10.309 MW. This hypothetical gain saves about 107 kW, or 941 MWh over 8,760 full-load hours. To compare bids, repeat the calculation at the expected part loads and include capital cost and cooling energy.
Three checks before committing rack capacity
At the grid connection. I would ask for two time series from the customer, one for a representative compute cycle and one for cluster start-up. Compare the resulting ramp rates in MW per second with the network operator’s connection conditions. Then repeat the simulation with the storage already partly committed. [1]
On the cooling loop. If water picks up 1 MW of heat and warms by 10°C, about 24 litres per second, or 86 m³/h, must recirculate. This uses a specific heat capacity of 4.18 kJ/(kg·K) and a density near 1 kg per litre. Ask the server supplier which fraction of rack heat enters the liquid. To select the coolant distribution unit (CDU), confirm temperatures and flows on both sides and the allowable pressure drop. The air system must remove the remaining heat. [4]
During maintenance or a fault. Direct current has no natural current zero-crossing to help extinguish an arc. The design needs DC-rated interrupting devices, coordinated protection to isolate the affected branch, and a safe isolation procedure that accounts for stored energy. I would ask to witness a feed-loss test with rack power and coolant pump operation recorded together. [1] [5]
Technical sources
- 1. NVIDIA. Jared Huntington and Mike Tu, 800 VDC Architecture for Next-Generation AI Infrastructure, 2025. See pages 5–9 and figures 10–11.
- 2. NVIDIA. Why Scaling AI Compute Performance Requires a New Power Architecture, 11 August 2026.
- 3. Open Compute Project. Solid State Transformer Specification, revision 0.3, 2026.
- 4. Open Compute Project. ACF Reference Design Guidance, section on water flow and temperature rise.
- 5. Schneider Electric. DC Arc Flash Analysis: A Practical Study on 800 VDC AI Data Centers, July 2026.
- 6. Delta. 800 V DC power and cooling equipment demonstrated at the OCP Global Summit, October 2026.
The NVIDIA DSX POD market study
Should a developer fund an 800 V hall now, reserve space for the next phase, or defer the investment? I address that decision in PowerlandMap’s independent study, NVIDIA DSX POD — Infrastructure, markets and investment decisions. It weighs the modular cost premium against grid lead times, liquid-cooling readiness and the commitments a developer needs before releasing capital.
The 23 October 2026 edition covers 13 countries across Europe and the Gulf. The 44-page report is available as a one-off purchase for €399 excluding VAT. The first four pages are free to read.
Preview the first four pages or buy the study on PowerlandMap
Apply this analysis to your project
You can engage The Blob Company for site feasibility, power strategy, development leadership and investment review. We can scope a focused review around your next decision.
Related analysis
AI Investment and the Value of Data Center Projects
AI growth does not guarantee the value of every project. Matthieu Gallego examines secured power, delivery timelines and qualified demand, supported by PowerlandMap intelligence and external sources.
AI infrastructure is becoming bankable, but not every AI project deserves financing
AI infrastructure is becoming easier to finance when power, customer contracts, tenant credit and technical delivery stand up to scrutiny. Bankability remains the differentiator.
The density shift reshaping AI infrastructure
Rack densities moving from 10 kW to 130 kW change site selection, cooling strategy and the economics of every powered land position in the pipeline.