
AI Investment and the Value of Data Center Projects
AI growth does not guarantee the value of every project. Matthieu Gallego examines secured power, delivery timelines and qualified demand, supported by PowerlandMap intelligence and external sources.
Cover image: AI-generated conceptual illustration of a data center campus and electrical infrastructure. It does not depict a specific project.
The data center industry has become accustomed to treating hyperscaler spending as a promise of growth for the entire sector. I believe that assumption has become too comfortable. Massive investment in AI can coexist with land that cannot find a buyer, grid connections that arrive too late, and buildings that do not meet a customer's requirements.
The chart attributed to BofA Research, comparing the cash-flow trajectories of hyperscalers and a basket of semiconductor companies, raises a useful question: where is value being created, and who carries the risk while the infrastructure is being built?
At The Blob Company, our view is that the next phase of the market will favour projects that can turn secured power into usable IT capacity when a creditworthy customer needs it. AI growth makes that discipline more necessary. It does not replace it.
What the chart tells us
The chart compares two distinct groups: Amazon, Alphabet, Meta, Microsoft and Oracle on one side, and Nvidia, Micron, Broadcom and Applied Materials on the other. It shows free cash-flow trajectories that include forecasts. Those estimates must be read in the context of their date and company coverage, rather than treating the endpoint as an achieved result. [1]
The economic mechanism is understandable. A supplier can collect payment for equipment before the buyer has fully monetised the infrastructure that will house it. But these two curves are not an accounting reconciliation of transfers between companies. Each group's businesses, customers, investments and timelines extend beyond that commercial relationship.
Depending on the definition used, free cash flow represents the operating cash remaining after certain capital investments. A decline can reflect an intensive construction programme while the underlying business remains profitable. It does not, by itself, demonstrate that AI is destroying value. It does require closer scrutiny of expected revenues, financing needs and the time between spending and cash generation.
Recent results show different financial positions
For the quarter ended 30 June 2026, Microsoft reported $55.4 billion in operating cash flow and $35.8 billion in cash payments for property, plant and equipment, resulting in $19.6 billion in free cash flow. It also reported $41 billion in capital expenditure, a measure that includes finance leases. Around two-thirds of that expenditure related to short-lived assets, primarily CPUs and GPUs. [2]
For the same calendar quarter, Meta reported $31.86 billion in operating cash flow, $31.08 billion in capital expenditure including principal payments on finance leases, and $784 million in free cash flow. Rounding explains the small arithmetic difference. [3]
These disclosures call for two distinctions. Hyperscalers do not all have the same financial headroom. And comparing their investment figures requires attention to accounting definitions. Expenditure including finance leases is not directly comparable to cash payments for fixed assets.
For a developer, the implication is practical: a multibillion-dollar global budget is not a commitment to an individual site. The task is to understand how much of that budget could translate into real estate, equipment, leased capacity or service contracts, and then identify the projects actually selected.
Electricity demand is growing but delivery remains local
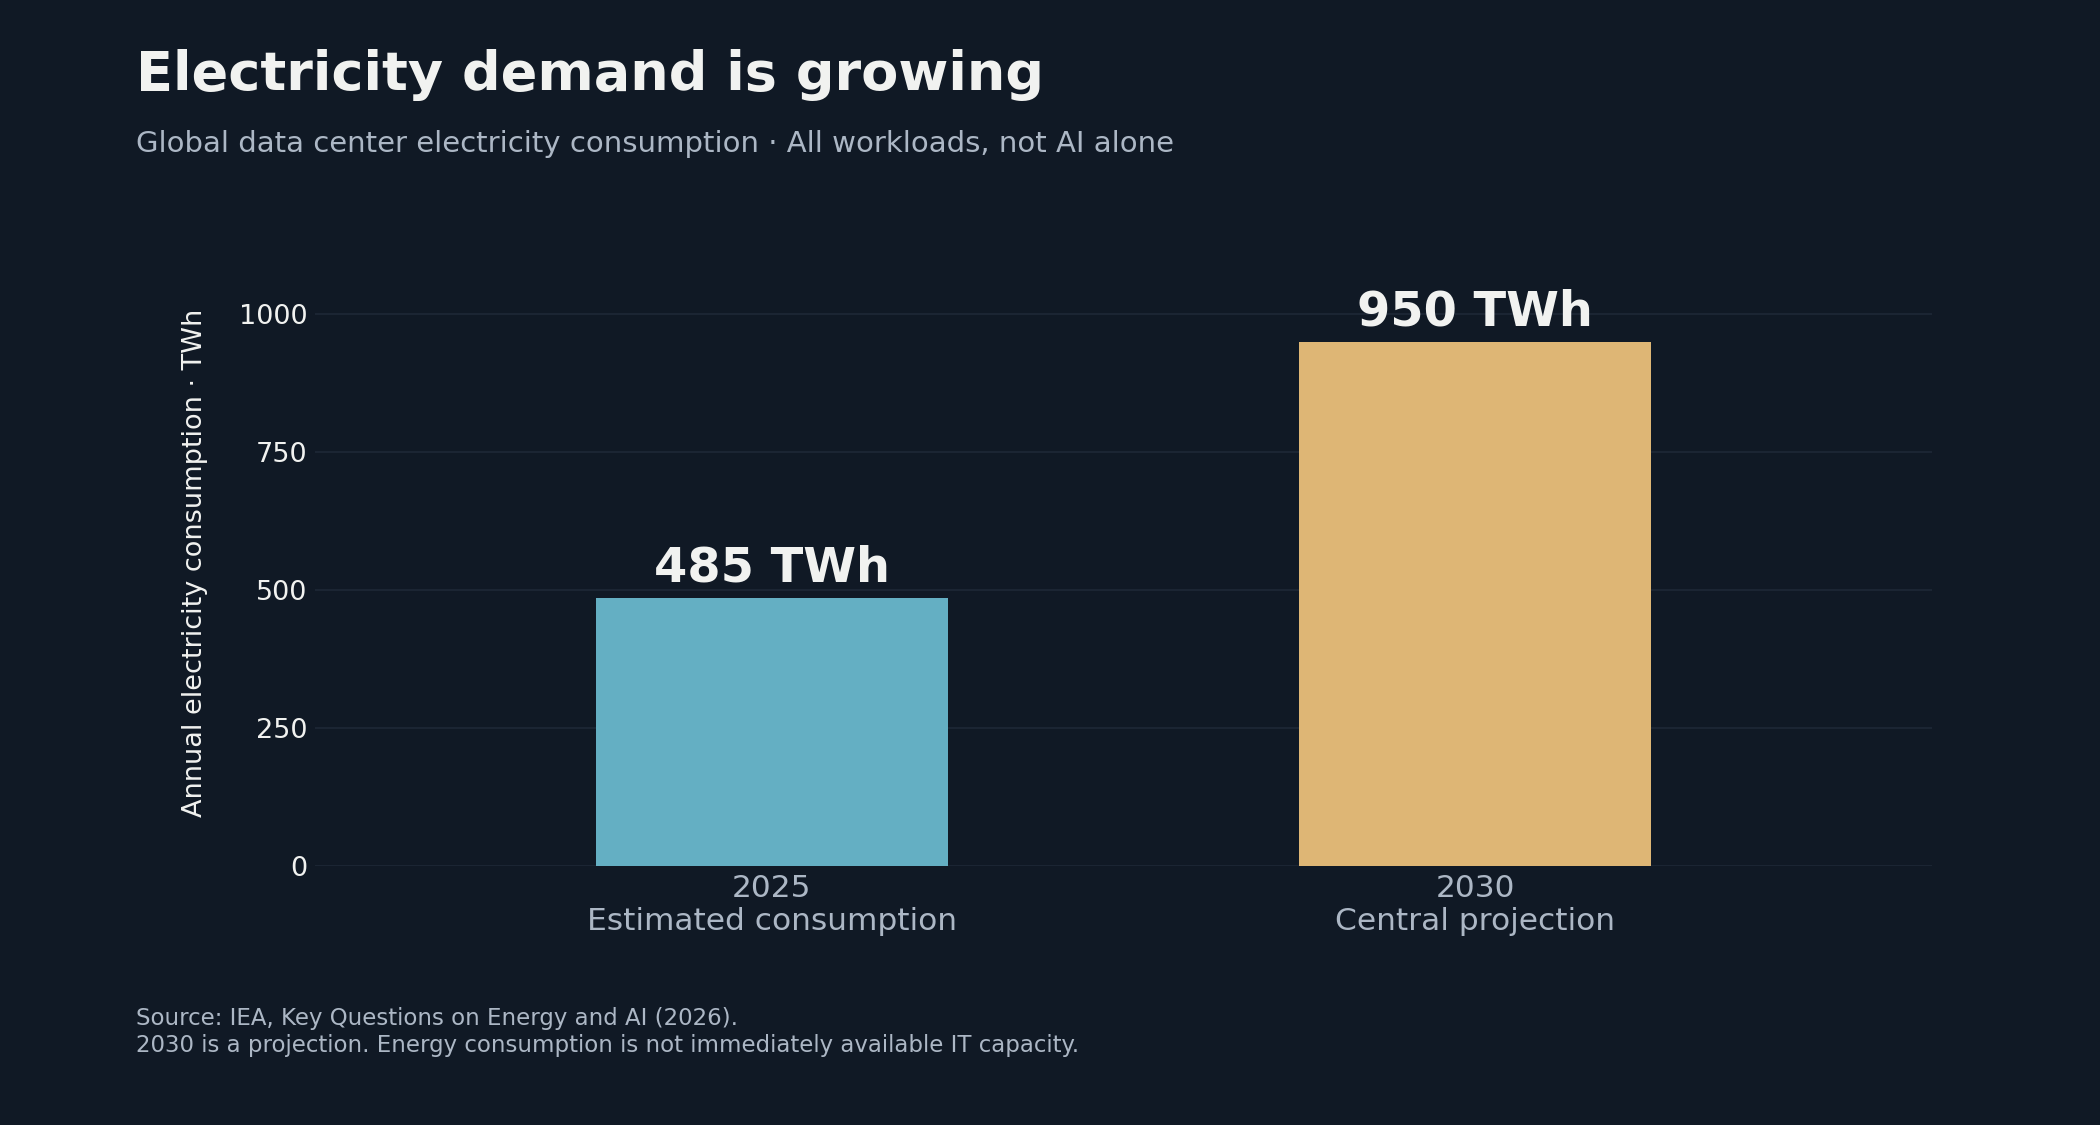
In its 2026 report, the International Energy Agency estimates global data center electricity consumption at 485 TWh in 2025 and projects approximately 950 TWh in 2030. This scenario covers all data centers, not just AI facilities. It describes annual energy consumption, not a volume of megawatts immediately available for sale or lease. [4]
The IEA also highlights constraints involving grids, equipment and financing. Its 2025 report estimated that, unless the identified constraints were addressed, around 20% of planned projects could face delays. It cited four to eight years to build new transmission lines in advanced economies. These figures describe system-level risks, not the connection lead time for every site. [5]
This is where much of a project's value is determined. A region can attract investment announcements while its power delivery schedule remains incompatible with customer requirements. A smaller site can be competitive if its first phase has a credible route to operation.
In my view, a site comparison should therefore begin with the timetable for usable capacity. Long-term potential comes next.
PowerlandMap shows why development stages must remain distinct
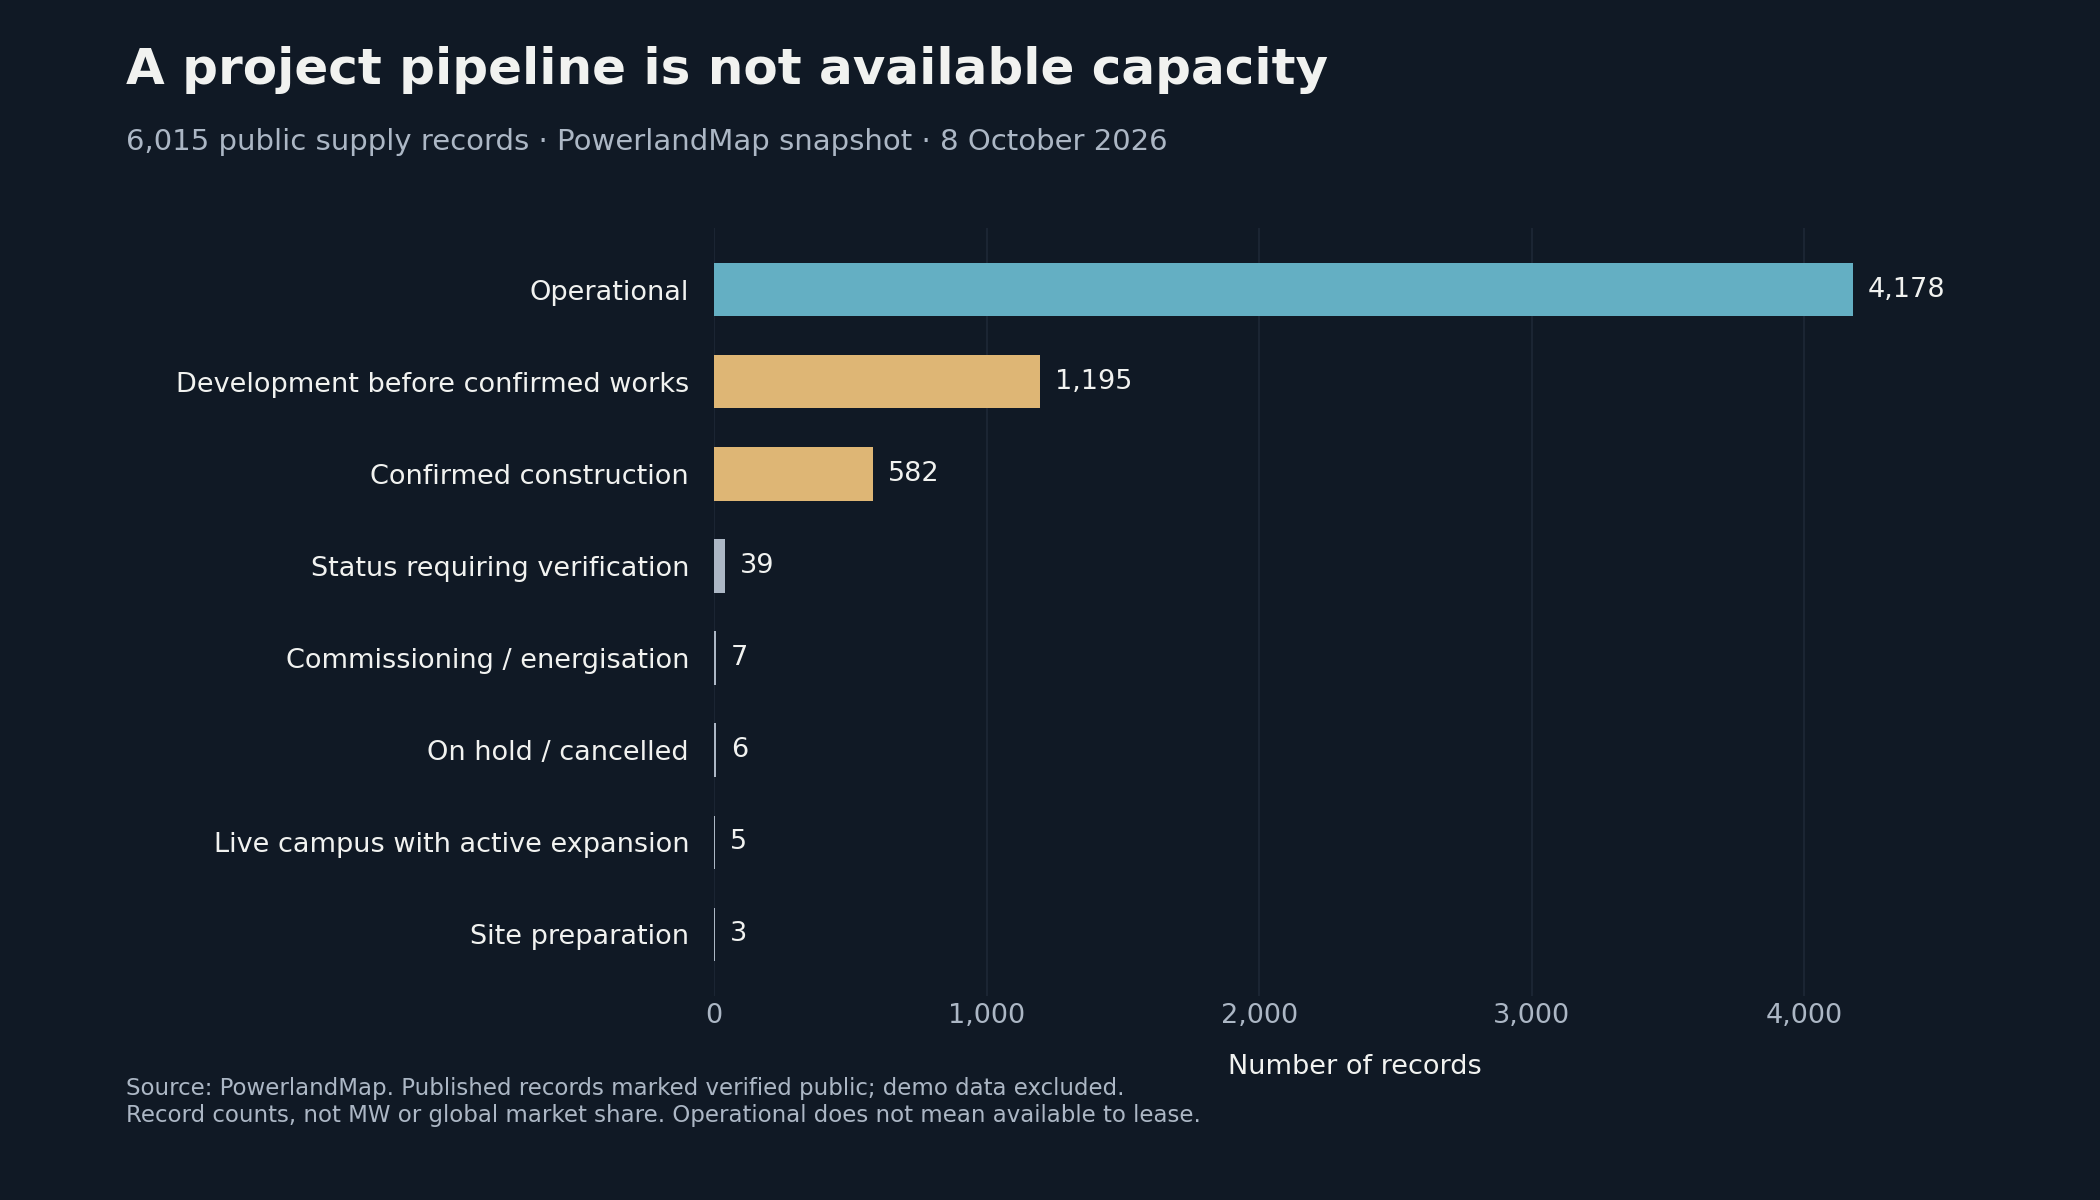
The PowerlandMap public supply extraction taken on 8 October 2026 contains 6,015 published records marked as verified public, excluding demonstration data. Breaking these records down by status separates operational facilities from the different stages of development. [6]
| Status within the observed dataset | Number of records |
|---|---|
| Operational | 4,178 |
| Development before confirmed site works | 1,195 |
| Confirmed construction | 582 |
| Site preparation | 3 |
| Commissioning or energisation | 7 |
| Operational campus with active expansion | 5 |
| Status requiring verification | 39 |
| On hold or cancelled | 6 |
| Total | 6,015 |
“Development before confirmed site works” includes announced and planned projects, development, planning and permitting, and preconstruction. This snapshot counts records without weighting them by capacity. It measures neither global market share nor project conversion rates. A record may represent a facility or a campus.
The distinction has immediate commercial relevance. An operational site is not necessarily available to lease. A confirmed construction project is not yet ready for a customer's equipment. An announced project has not necessarily secured its grid connection.
Capacity requires the same discipline. In this extraction, 1,164 records contain a positive value in the reported IT capacity field, while 4,511 have only a positive estimate across the two capacity fields examined. Two of the 1,164 records also contain an estimate. The remaining 340 records have no positive value in either field. An estimate can help assess a market. It is not a delivery commitment.
On the demand side, PowerlandMap also separates categories: the current extraction identifies, among other categories, 119 modelled corridors and 25 contracted offtake records. These cannot be treated as an equivalent number of new customers immediately searching for a site. A model describes a market opportunity. A contract may already be allocated to an infrastructure project.
This distinction is central to the value of market intelligence. Adding points to a map is not enough. We need to understand what each point actually supports.
Valuation premiums should reflect risks that have been resolved
Land close to a substation warrants investigation. Proximity alone does not establish that the required power can be supplied. Grid capacity, studies, necessary works, contractual conditions and delivery dates all sit between those two propositions.
Our position is that valuation should reflect the removal of these uncertainties. Control of the land creates initial value. A documented connection pathway, appropriate permits and a credible development cost can create more. A strong commercial commitment changes the risk profile further.
This approach avoids assigning the same value to megawatts that are announced, requested, reserved or deliverable. It also avoids confusing a site's electrical capacity with its usable IT capacity. Auxiliary loads, cooling, resilience architecture and operating conditions must be considered when translating one into the other.
I favour an approach that preserves the option value of expansion while grounding the base case in what can be demonstrated. Making initial returns depend on an uncertain extension means financing a risk that is not always explicitly acknowledged.
Phasing should protect capital without restricting growth
Phased development can limit expenditure committed before revenue begins. It becomes particularly attractive when an initial phase has a shorter route to delivery than the full campus.
But phasing is not automatically the best solution. Shared substations, networks or equipment may require substantial investment at the outset. A phase that is too small may lose competitiveness. And a poorly positioned first phase can make later expansion more difficult.
The cost of phased delivery must therefore be compared with the cost of committing to the whole development, taking account of capital tied up and revenue available at each stage.
Consider a purely illustrative example: €50 million already committed to a project, with an assumed annual carrying cost of 8%. A six-month delay would represent approximately €2 million in additional carrying costs, before the other effects of the delay. This simplified calculation is neither a market benchmark nor an actual financing quote. It shows why timing belongs in the economic assessment from the outset.
A cheaper site can become the more expensive option if delays consume its initial advantage.
The right infrastructure depends on the customer and the workload
Referring to “AI demand” without specifying the workload leaves too many questions unanswered. A customer training large models, an inference service and a conventional colocation user do not necessarily require the same combination of density, connectivity, availability and location.
Before fixing the technical brief, I want to understand the workload profile, proposed equipment, power ramp-up, cooling requirements and service continuity constraints. The design should meet an identifiable requirement while preserving reasonable flexibility.
The same discipline applies to commercialisation. A recognisable brand in a presentation does not constitute secured demand. The contracting entity, decision-making process, required delivery date and conditions for commitment must all be identified.
An expression of interest, a conditional reservation and a binding contract carry different levels of value. Presenting them separately allows an honest discussion of risk with the funder and the owner.
What I would require before financing a project
The debate over a possible AI bubble does not remove the need to assess each investment. Sustained market growth can coexist with poorly located or excessively expensive projects. A correction can also leave value in assets that meet robust demand.
Before a decision, I would ask for five things:
- 1.A documented power delivery schedule, including the conditions still to be met.
- 2.A technical brief suited to the target customer, with a complete cost assessment through to operation.
- 3.An assessment of competing supply by delivery date, availability and technical characteristics.
- 4.Qualified demand, clearly separating interest, reservations and contractual commitments.
- 5.A downside scenario combining delays, cost increases and slower commercialisation.
Market intelligence helps direct this assessment and identify inconsistencies. It must then be tested against project documentation and the work of the technical, commercial and financial teams.
Our view on the next phase of the market
I remain convinced that AI development creates lasting infrastructure requirements. I am much more selective about each project's ability to capture that value.
At The Blob Company, we want to connect site identification, power security, development and commercialisation to one question: what can we deliver, to whom, when and at what cost? PowerlandMap provides a structured view of the market to inform that decision. Development work then turns that assessment into verifiable commitments.
A campus's announced size can attract attention. Its value is built through the conditions that enable a customer to use it and pay for it.
Sources and methodology
[1] BofA Research Investment Committee chart supplied as the starting point. Visible company groups: AMZN, GOOGL, META, MSFT, ORCL and NVDA, MU, AVGO, AMAT. Context provided by Yahoo Finance, 13 July 2026. The supplied crop does not show its full title or issue date. No numerical series has been reconstructed from the image.
[2] Microsoft FY2026 fourth-quarter earnings conference call, 29 July 2026. Quarter ended 30 June 2026. Investment amounts and definitions follow the company's disclosure.
[3] Meta second-quarter 2026 results, 29 July 2026. Quarter ended 30 June 2026. Capital expenditure includes principal payments on finance leases.
[4] International Energy Agency, Key Questions on Energy and AI, 2026. Estimated 2025 consumption and central 2030 projection. Covers all data centers.
[5] International Energy Agency, Energy and AI, 2025. Conditional delay risks and transmission line lead times. These findings are not forecasts for individual sites tracked by PowerlandMap.
[6] PowerlandMap, direct extraction dated 8 October 2026. Supply: published public supply records marked as verified public, with demonstration data excluded. Detailed statuses distinguish construction, site preparation and commissioning. Capacity counts reflect the presence of positive values in the reported and estimated IT capacity fields, without adding megawatt totals. Demand: current indicators by category. Results describe the tracked dataset at the extraction date, with coverage and freshness varying by market. They are not an exhaustive census, a technical audit or a guarantee of availability. No confidential project or private customer is identified.
The interpretations and decision criteria express The Blob Company's views. The carrying-cost example uses explicitly illustrative assumptions.
Work with us
Need this level of analysis on your own pipeline
We advise developers, investors and operators on powered land, grid strategy and data center demand — from site qualification to commercialisation
Related analysis
AI infrastructure is becoming bankable, but not every AI project deserves financing
AI infrastructure is becoming easier to finance when power, customer contracts, tenant credit and technical delivery stand up to scrutiny. Bankability remains the differentiator.
The density shift reshaping AI infrastructure
Rack densities moving from 10 kW to 130 kW change site selection, cooling strategy and the economics of every powered land position in the pipeline.
Data centre delays should change how projects are valued
A deliverable 40 MW IT phase can be a stronger investment than a speculative gigawatt campus. Matthieu Gallego argues that valuations and acquisition payments should follow verified power, customer and commissioning milestones.